The sample comes from one visitor profile: logged out, desktop, English (UK), rupees, an Indian connection. Booking.com personalises and A/B tests heavily, so a different visitor may see a different page, and price display in particular depends on market. Prevalence figures describe the first page of results under the default sort, not the whole inventory. The five sessions received two different rankings, so any single-session figure (including the main sample) describes one version of the page. Severity ratings and impact estimates are expert judgements; every other figure is measured and can be checked in the data tables.
Booking.com
The persuasion layer
Independent UX audit
No. 02 · September 2026 · 16 min read
Every hotel listing on Booking.com is two products at once: the room, and a layer of messages designed to make you book it now. I measured that layer across 1,500 search results in ten cities to find out what it says, how much of it is true, and what it costs the person deciding.
Sample
1,506 listings from 5 browser sessions, plus 30 property pages and 10 checkouts, across 10 cities
Methods
Automated capture of live pages, content coding, inventory cross-check, heuristic review
Lens
Persuasion design: where it helps people decide and where it decides for them
Disclosure
Independent work. Not commissioned by or affiliated with Booking.com
00 — Summary
42–89%
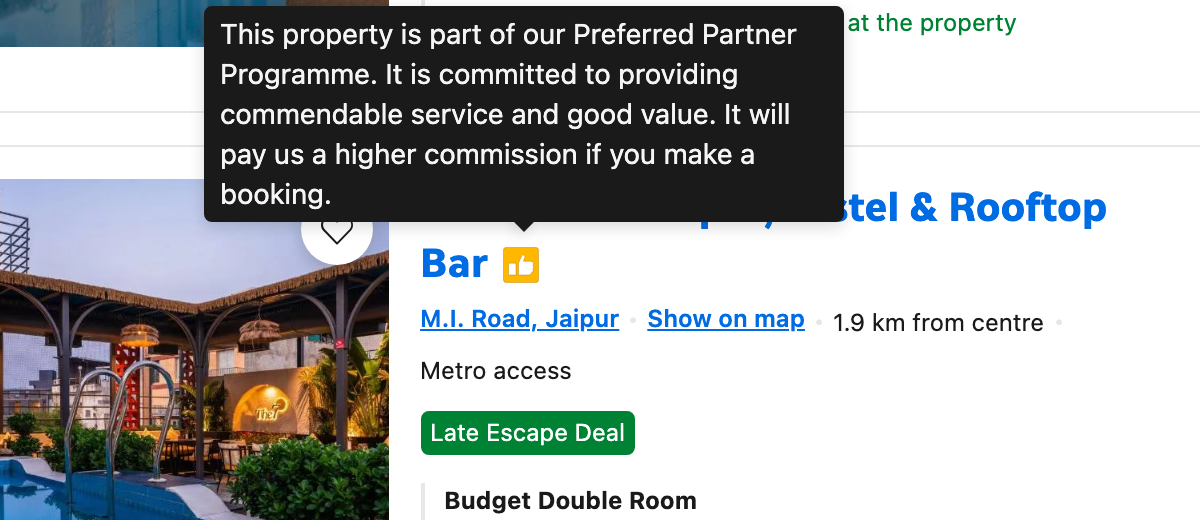
of first-page listings carry a yellow thumbs-up whose hidden meaning is “It will pay us a higher commission if you make a booking.” Which figure you get depends on the session. The same searches, run in five sessions within ninety minutes, returned one of two different result pages.
Persuasion signals per listing
2.1
Mean across the 500 priced listings of the main sample. One in three carries three or more
Listings with a struck-out price
51%
Median 30% off. 73% of these have no named deal to explain the “original” price
Headline price excludes tax
81%
For a visitor in India. Tax adds a median 9.3%, and 27% in Dubai
Scarcity claims that checked out
54/54
Every “We have N left” matched the number of rooms you could actually select
-
01The most common badge is a paid one
In three of five sessions, nearly nine in ten first-page listings carried the commission badge. It looks like an endorsement and is explained only on hover.
-
02Scarcity is true, stable and tuned
Every scarcity count matched bookable inventory, and 95% held across sessions. But the message switches on at seven rooms or fewer, so more than a third of listings look scarce.
-
03When half the page is “discounted”, the discount means little
Half of all listings show a struck-out price. Most don't say what the original price was or when it applied.
-
04The price you compare isn't the price you pay
In 37 of the 213 discounted listings that also excluded tax, the tax added on top was larger than the discount shown.
-
05Checkout is restrained
The pressure is all on the results page. At checkout there are no pre-ticked boxes, every cross-sell is opt-in, and “No payment today” is stated plainly.
01
Context and method
Few interfaces have been A/B tested as heavily, and few draw as much criticism
Booking.com's experimentation culture is a business-school case study.1 Thousands of tests a year shape every pixel of the results page. That makes it an unusually honest subject: what's on the page is there because it measurably increases bookings.
It has also drawn regulators. In 2019 the UK's Competition and Markets Authority secured commitments from Booking.com and five other sites to change how they present scarcity, discounts and paid placement.2 Persuasion on these pages is a design problem, a commercial problem and, increasingly, a legal one.
How the sample was collected
Searches were run for ten cities (five in India, five international), each for two date windows: a November weekend (20–22 Nov 2026) and a February midweek stay (9–11 Feb 2027). Every search used two adults, one room, the default “Our top picks” sort, a logged-out session, a desktop browser set to English (UK) and Indian rupees, from an Indian connection. I captured the first page of results, the top three property pages in each city and one checkout per city, and coded every message on every listing. The November searches were then repeated in four more independent browser sessions over the next ninety minutes, to test whether what a visitor sees is stable.
Listings coded
1,506
502 in the main sample (both date windows), plus four repeat sessions of 251
Cities
10
Goa, Mumbai, Jaipur, Bengaluru, New Delhi, London, Paris, Dubai, Bangkok, New York
Property pages
30
Top three per city, with room-selector inventory recorded
Checkouts
10
Taken as far as the guest-details step, never submitted
02
Anatomy of a listing
One card, seven signals, and only two of them describe the room
A single result card is the densest piece of persuasion design on the web. The example below, taken from the Jaipur sample, is typical rather than extreme. Each numbered element is a separate claim competing for the same few seconds of attention.
Pressure signals are in red; information and reassurance are in black. Notice where each sits: the red claims cluster around the price and the call to action, exactly where the decision happens.
Fig. 01A listing card, annotated
Hover over or tap a number for detail. Red marks a pressure signal, black an informational one.
Source: Booking.com search results, Jaipur, 20–22 Nov 2026, captured by the author
Fig. 02How often each signal appears
Share of the 500 priced listings in the main sample (session 1) showing each element. Pressure and framing signals are in red; information and reassurance in grey. Chapter 03 shows how the badge rate changes between sessions.
Source: author’s coding of 500 priced listings
Fig. 03Pressure signals per listing
Number of pressure signals per card: commission badge, struck-out price, scarcity, named deal, members-only price, paid placement, “new to Booking.com”. Only 2% of listings have none; listings with three or more are highlighted.
Source: author’s coding of 500 priced listings
Fig. 04The mix changes by city
Share of listings per city showing each pressure signal. The pattern varies by market rather than following a fixed template.
Source: author’s coding, session 1, 50 listings per city
Three things stand out. Tax display is decided by market, not by city: London and Bangkok show tax-inclusive prices, while Paris and New York don't. Scarcity varies sharply: 82% of Jaipur listings carry it, against 16% in Bengaluru and New Delhi. And the commission badge is near-universal everywhere except Bengaluru (30%).
03
The commission badge
A paid relationship, designed to look like a rating
The thumbs-up is the same yellow as the star rating and sits directly next to the hotel name. Nothing on the card says what it means. A sighted desktop user must hover over a 24-pixel icon; a mobile user must tap it, which few people do on an icon they assume they already understand.
The disclosure itself is honest. The problem is the gap between how the badge looks (an endorsement) and what it is (a commercial arrangement). By the standard of Nielsen's “match between system and the real world”,3 a thumbs-up means recommended, not pays us more.
Fig. 05The disclosure, on hover
The only place the badge’s meaning appears. There are two tiers, “Preferred Partner” and “Preferred Plus”, with identical icons.
Source: Booking.com, captured by the author
Same search, two different first pages
Repeating the November searches in five fresh sessions exposed something the single sample hid. Every session got one of two distinct result pages. Sessions on the same version shared 71–99% of their listings; sessions on different versions shared 16%. On one version the commission badge covered 87–89% of page one, with “Preferred Plus” (the higher tier) on 27–30% of listings. On the other it covered 42%, with Preferred Plus on 4–5%.
What didn’t change is just as revealing. Tax display, scarcity and labelled ads were nearly identical across all five sessions. Struck-out prices and named deals moved with the badge, because they came with the properties. The variable was the ranking: which properties “Our top picks” chose to show first. That is consistent with a live ranking experiment. For a visitor, it means the default sort’s idea of a “top pick” depends on which version they happen to be served, and nothing on the page says so.
Fig. 06Five sessions, two result pages
Share of page-one listings showing each signal, for the same ten November searches run in five independent sessions. Red: the three sessions served the commission-heavy version. Black: the two served the other.
Source: author’s coding, 5 × 251 listings, captured within 90 minutes
The contrast with explicit paid placement is telling. Listings marked “Ad” or “Featured” (6.6% of the sample) say so in visible text, and the labels are clear. Ads land in fixed slots near the top, most often position two.
Fig. 07Where labelled paid placements appear
Count of “Ad” and “Featured” listings at each results position, across all 20 searches. Positions 2, 4 and 6 are highlighted: every “Ad” appeared in one of them.
Source: author’s coding, session 1, 33 labelled placements in 20 searches
04
Scarcity
“We have 4 left” is true. The design question is when to say it.
Scarcity claims are the most criticised element of booking interfaces, so I tested them. On every property page sampled, I compared each “We have N left” message with the maximum quantity in that room's selector, the number of rooms Booking.com will actually let you reserve. All 54 matched.
The interesting finding is the threshold. Messages appeared for counts from one to seven and never at eight or above, even though many rooms had eight, nine or ten available. Every claim is accurate. The design choice is to announce scarcity at a level of inventory that, for most hotels, is normal.
The wording matters too: “left at this price” and “we have” describe Booking.com's allocation, not the hotel's total rooms. That's precise, and easy to misread as “the hotel is nearly full”.
Fig. 08The number of rooms each scarcity message claims
180 scarcity messages on search cards, by the number of rooms claimed. Nothing appears above seven. That isn't a lack of inventory; it's where the message switches off.
Source: author’s coding of 500 priced listings; inventory cross-checked on 30 property pages
The repeat sessions add one more check. Where the same hotel appeared in two sessions, it showed the same scarcity message, or the same absence of one, in 302 of 319 comparisons (95%). The rest were small moves such as “5 left” becoming “4 left”. These messages are not randomised to create urgency. They report inventory, then frame it.
05
Discounts
When half the page is on sale, “on sale” stops meaning anything
A struck-out price is an anchor. It makes the real price feel like a gain. It works best when it is rare and when its reference is clear. Here it is neither: 51% of listings carry one, and only 69 of those 257 (27%) are tied to a named deal such as “Limited-time Deal” or “Late Escape Deal”.
The other 188 rely on the card's ⓘ icon to explain what “original” means. Compare EU price rules, which require any claimed reduction to be measured against the lowest price of the previous 30 days.4 A struck-out price that doesn't say what it is being compared with is a weak claim, even when it's accurate.
Fig. 09How big the claimed discounts are
257 struck-out prices, grouped by the discount implied. Median 30%; 60 listings claim more than half off.
Source: author’s coding of 500 priced listings
06
Price display
The biggest number on the card is not the amount you pay
For this visitor, 81% of headline prices excluded tax, which was shown in smaller grey text underneath. Behavioural research calls this partitioned pricing: when a price is split into parts, people anchor on the larger part and under-weight the rest.5
The size of the gap depends on the city. In Goa or Delhi it’s about 5%. In Dubai it’s 27%, enough to change which hotel fits the budget.
Fig. 10Tax added on top of the headline price, by city
Grey bar: the middle half of listings. Red dot: median. London and Bangkok show tax-inclusive prices.
Source: author’s coding; tax as a percentage of the headline price
The two techniques combine. A Goa resort in the sample showed ₹35,014 struck out, ₹26,190 in bold, an apparent 25% saving. The ₹5,357 in taxes underneath brings the real total to ₹31,547, so the actual saving is 10%.
Fig. 11How much of the discount the tax takes back
213 listings showed both a struck-out price and a tax-exclusive headline. Tax is compared with the size of the discount shown.
Source: author’s coding of 500 priced listings
One fair caveat: because tax-exclusive prices are applied consistently within a search, they reordered the price ranking in only 0.9% of listing pairs. The harm isn't in choosing between hotels on Booking.com. It is in comparing Booking.com with other sites, and with your own budget.
07
The first mobile screen
You searched for hotels. A quarter of the first screen shows one.
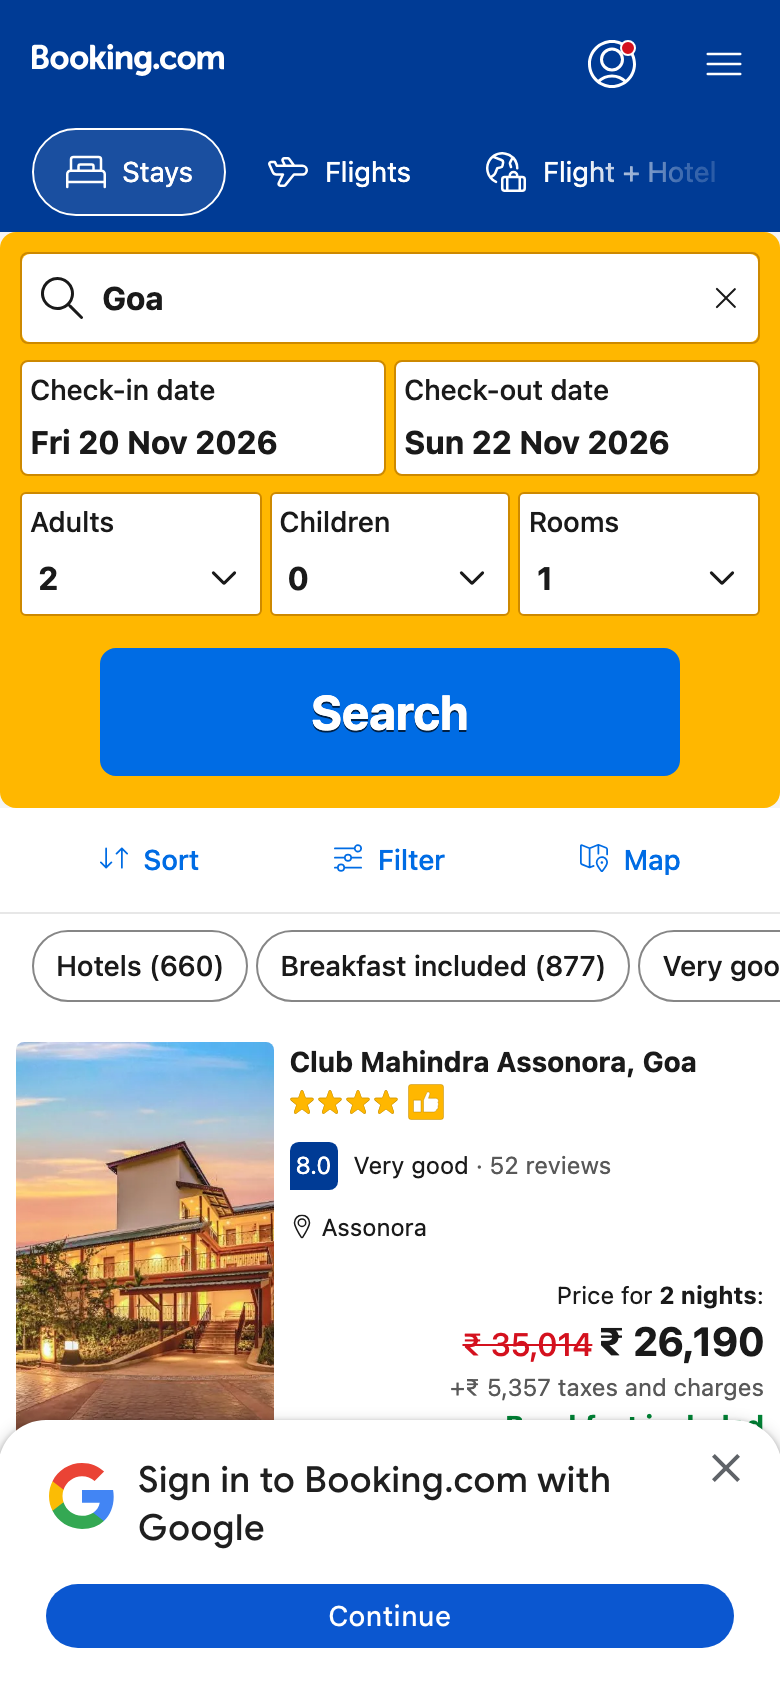
On a 390 × 844 phone viewport, the results page opens with the full search form you have just filled in, still expanded. Below it are sort and filter controls, and over the bottom of the screen a Google sign-in sheet. The first listing gets 24% of the screen, and its details are cut off by the sheet.
Fig. 12What fills the first screen
The results page for Goa on first load, measured by vertical space.
Source: author’s capture, 390 × 844 viewport
08
What works
Checkout shows what the results page could be
It would be easy to write this audit as a list of dark patterns. That would be inaccurate. Nothing tested here was false, and the checkout is a model of restraint that many smaller sites could learn from.
Pre-ticked boxes at checkout
0
All 50 checkboxes across 10 checkouts, including paperless confirmation and cross-sells, started unticked
Required fields
5–7
Name, email, country, phone; address only for some properties
Steps
3
Clearly numbered. No account required
Listings offering free cancellation
54%
Shown on the card itself, in green with a checkmark
Reassurance is designed as carefully as pressure
“Free cancellation” and “No prepayment needed” are the most useful lines on the card. They lower the risk of booking without inventing urgency, and Booking.com gives them prominence.
The payment schedule is explicit
“No payment today. You’ll pay when you stay.” Cancellation deadlines appear as a date, not a policy link. This is the clearest risk information in the whole flow.
Cross-sells are opt-in
Flights, car hire and taxis appear as unticked checkboxes. The incentive to pre-tick them is obvious, and Booking.com doesn't.
09
Findings
Seven issues, none of them false claims. The problem is framing, not fact.
Severity is rated on how much each issue distorts the user’s decision, combining how often it appears (measured) with how misleading it is (judged). No issue is rated critical: no claim tested was untrue.
Fig. 13Issue register
Severity: critical, serious, minor. Each is shown with a label, never by colour alone.
10
Recommendations
Keep the persuasion. Make it as honest in form as it already is in fact.
Booking.com has already done the hard part: its claims are true. What’s left is presentation. Each recommendation below keeps a working mechanism and changes only how clearly it is presented, which is where trust is won or lost.
Fig. 14Impact vs effort
Six recommendations. Red points are quick wins: high impact for low effort.
Source: author’s estimates
-
R1
Label the commission badge in words
Replace the thumbs-up with a visible text tag such as “Partner”, and move it away from the star rating. The disclosure already exists; it just needs to be visible.
-
R2
Show total price by default, in every market
Booking.com already shows total prices in some markets. Making it the default everywhere removes the biggest gap between the price seen and the price paid.
-
R3
Give every struck-out price a reference
Show what the original price was: “vs. lowest price in last 30 days”, or “vs. the hotel’s own rate”. Where none can be given, remove the strike.
-
R4
Cap each card at two pressure signals
Rank the signals by how useful they are to the decision and show the top two. Reassurance (cancellation, prepayment) should always outrank pressure.
-
R5
Collapse the search form on mobile results
Replace the expanded form with a one-line summary chip (“Goa · 20–22 Nov · 2 adults”) and defer the sign-in sheet until after the first scroll.
-
R6
Give scarcity a denominator
“4 of 40 rooms left on Booking.com” is just as true and far less alarming. Alternatively, raise the threshold so the message appears only when it is genuinely unusual.
11
What other teams can take from this
Persuasion isn’t the problem. Asymmetry is.
Every message on a Booking.com card is optimised to be acted on, and only some are optimised to be understood. The scarcity count, the struck-out price and the thumbs-up all win on first read and lose on second.
Any team running conversion experiments faces the same trap. A test measures what users do in the next few seconds, not what they believe the next day. A useful rule: if a design only works when the user doesn’t fully understand it, it isn’t finished. Pair every conversion metric with a comprehension check, and the honest version of a pattern usually turns out to be the durable one.
Limitations
Sources
- Thomke, S. (2020). Experimentation Works: The Surprising Power of Business Experiments. Harvard Business Review Press
- UK Competition and Markets Authority (2019). “Hotel booking sites to make major changes after CMA probe.” gov.uk
- Nielsen, J. (1994). “10 Usability Heuristics for User Interface Design.” Nielsen Norman Group
- Directive (EU) 2019/2161 (“Omnibus”), Article 6a on price reduction announcements
- Morwitz, V., Greenleaf, E. & Johnson, E. (1998). “Divide and Prosper: Consumers’ Reactions to Partitioned Prices.” Journal of Marketing Research
- Mathur, A. et al. (2019). “Dark Patterns at Scale: Findings from a Crawl of 11K Shopping Websites.” Proc. ACM CSCW. Method reference for automated pattern coding